Machine Learning for Genetic Studies
Additional plots and information:
Genetic data
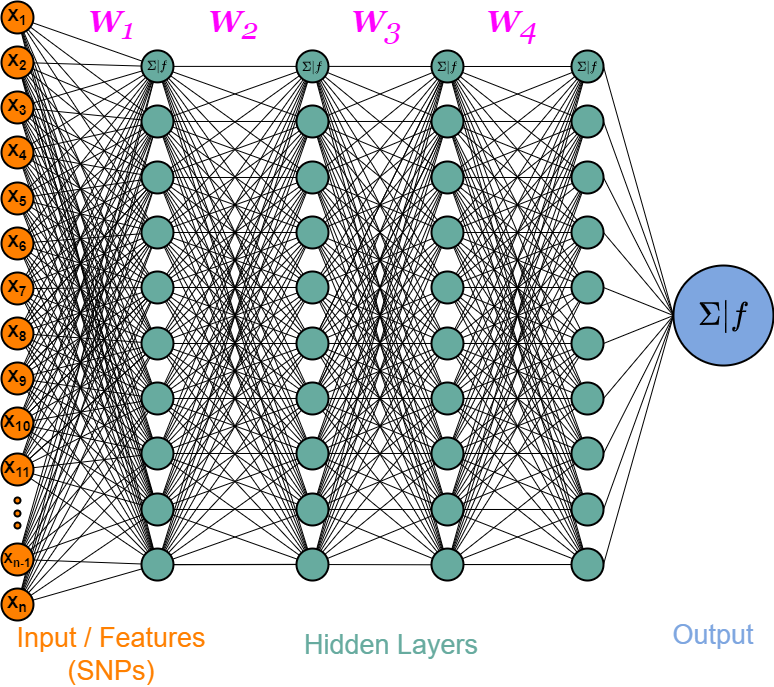
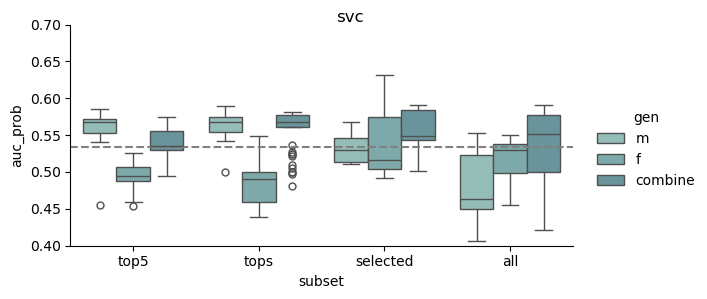
This study was based on a subset of genetic regions previously identified in the largest GWAS to date1. The subset consisted of 7 833 SNPs and is henceforth referred to as the “full” set. From the “full” set three feature subsets of varying size were created. The feature set “top5” contain the five SNPs with the lowest p-value among all genome-wide significant SNPs in the previous GWAS, while “tops” contain all SNPs with a p-value below 1e-8 (n = 23). For the last feature set we implemented an additional feature reduction method. We used ‘SelectKBest’ to select the 100 most significant features according to the ANOVA f-score.
| Name | Reduction | Selection | Features (nr) |
|---|---|---|---|
| Full | GWAS | No | 7 833 |
| Tops | GWAS | p-value $< 1e^{-8}$ | 23 |
| Top5 | GWAS | min p-value | 5 |
| Selected | GWAS + f-anova | top k | 100 |
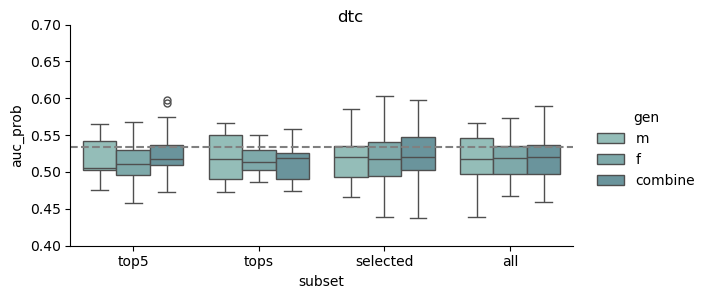
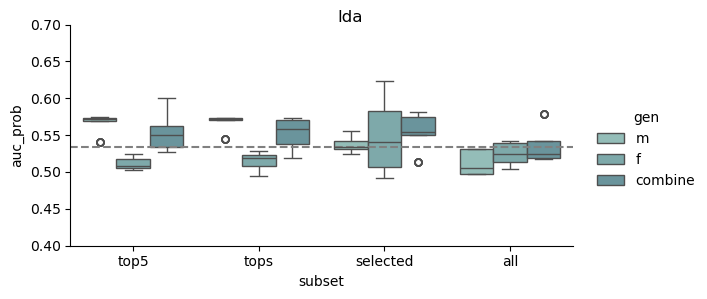
Plots

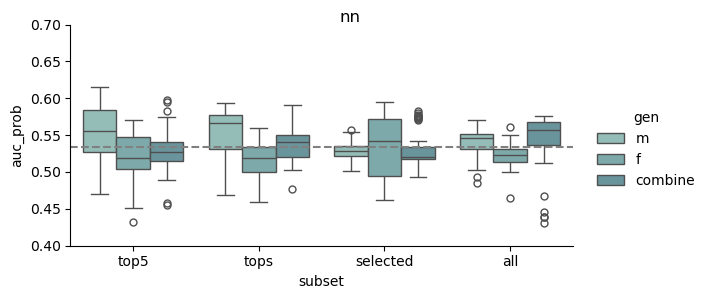
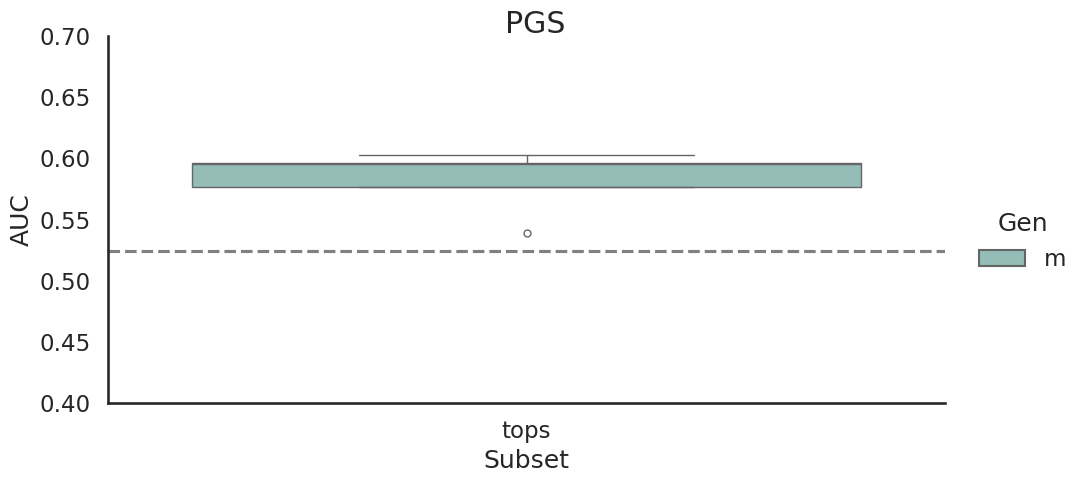
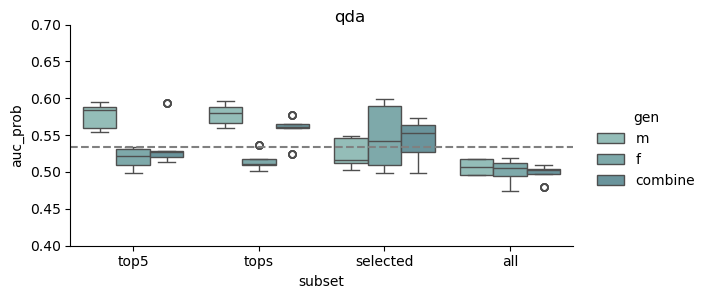
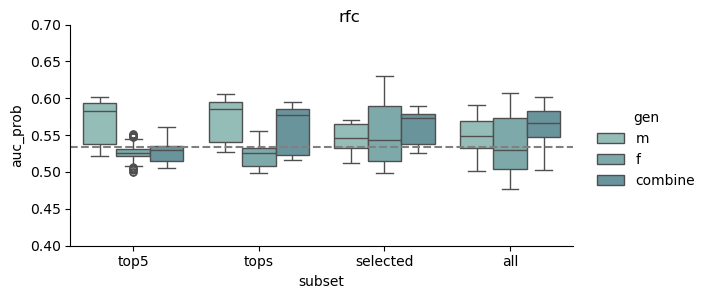
Models